California’s Energy Systems
An analysis of 20 years of California’s energy reports.
Project Summary
In the wake of California's 2022 rolling blackouts, I analyzed two decades of state energy data (2001–2021) to investigate two questions: what the blackouts reveal about the future of California's grid, and how the state can maintain a reliable electricity supply as it phases out fossil fuels.
Working in Python (Google Colab), I applied dimension reduction techniques (PCA, MDS) and built and compared five predictive models (simple linear regression, multiple linear regression, LASSO, k-NN regression, and k-NN classification). I then evaluated performance metrics to identify the best-fit approach for the dataset. Results were presented in a 30-page report and a seven-minute presentation.
Project Links
Project Report
CA Energy Systems: Revisited
Two years later, I returned to this dataset to rebuild the analysis in Tableau, creating two interactive dashboards, shown below and linked here and here, that reveal patterns that weren't visible in the original static charts.
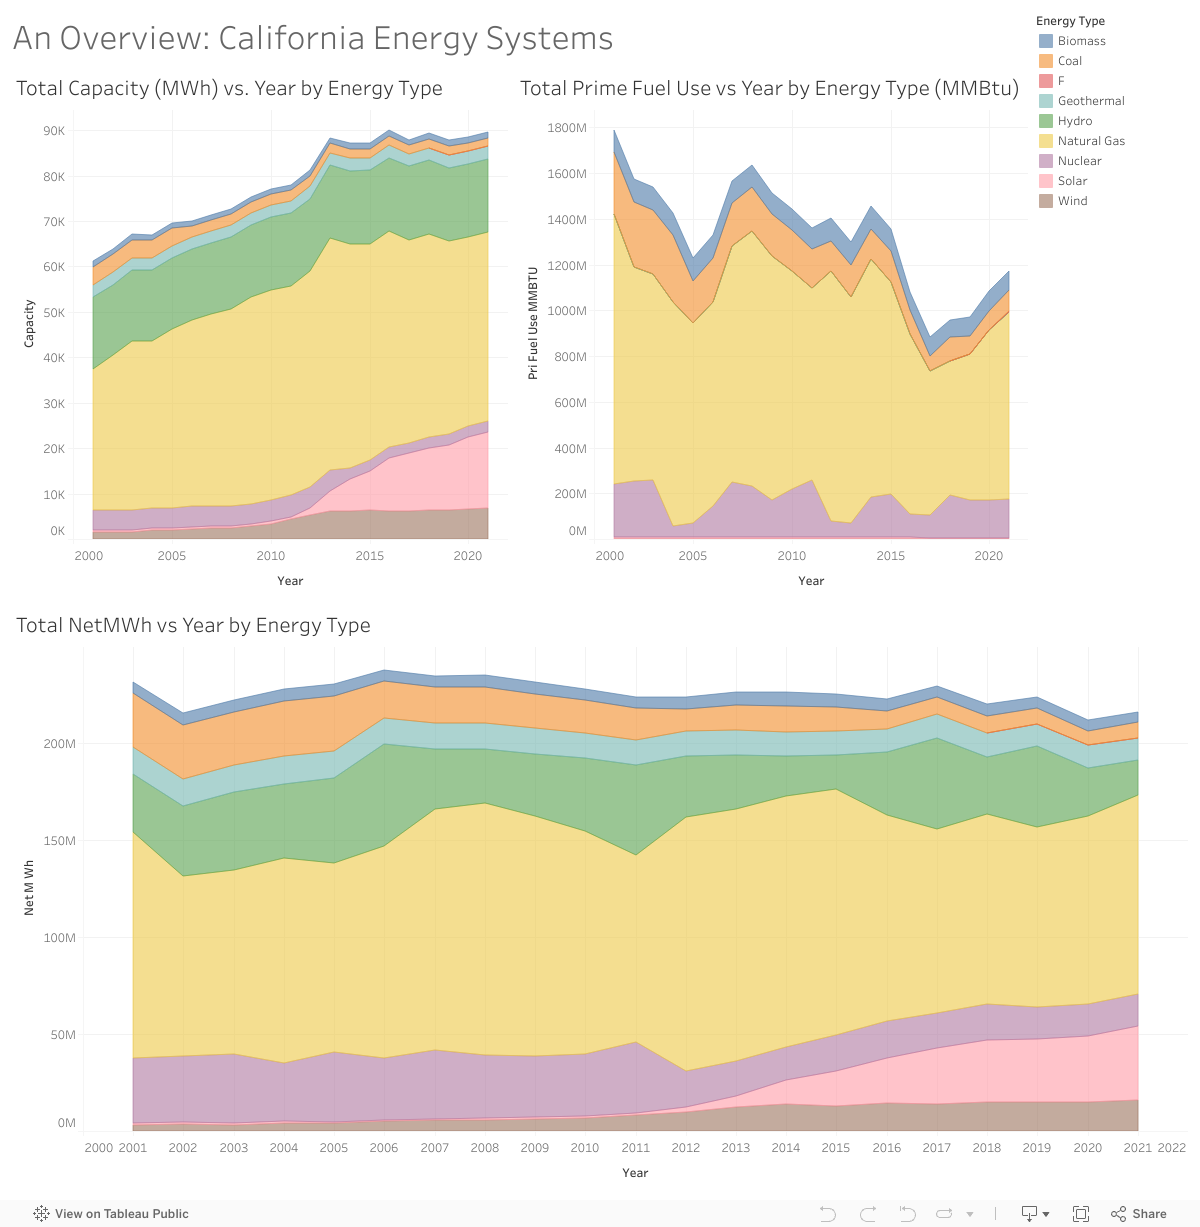
The first interactive dashboard tracks total capacity (MWh), fuel use (MMBtu), and net generation by energy type over time. It makes the acceleration of solar capacity post-2012 immediately visible. However, these graphs also emphasize the significant amount of energy produced by natural gas.
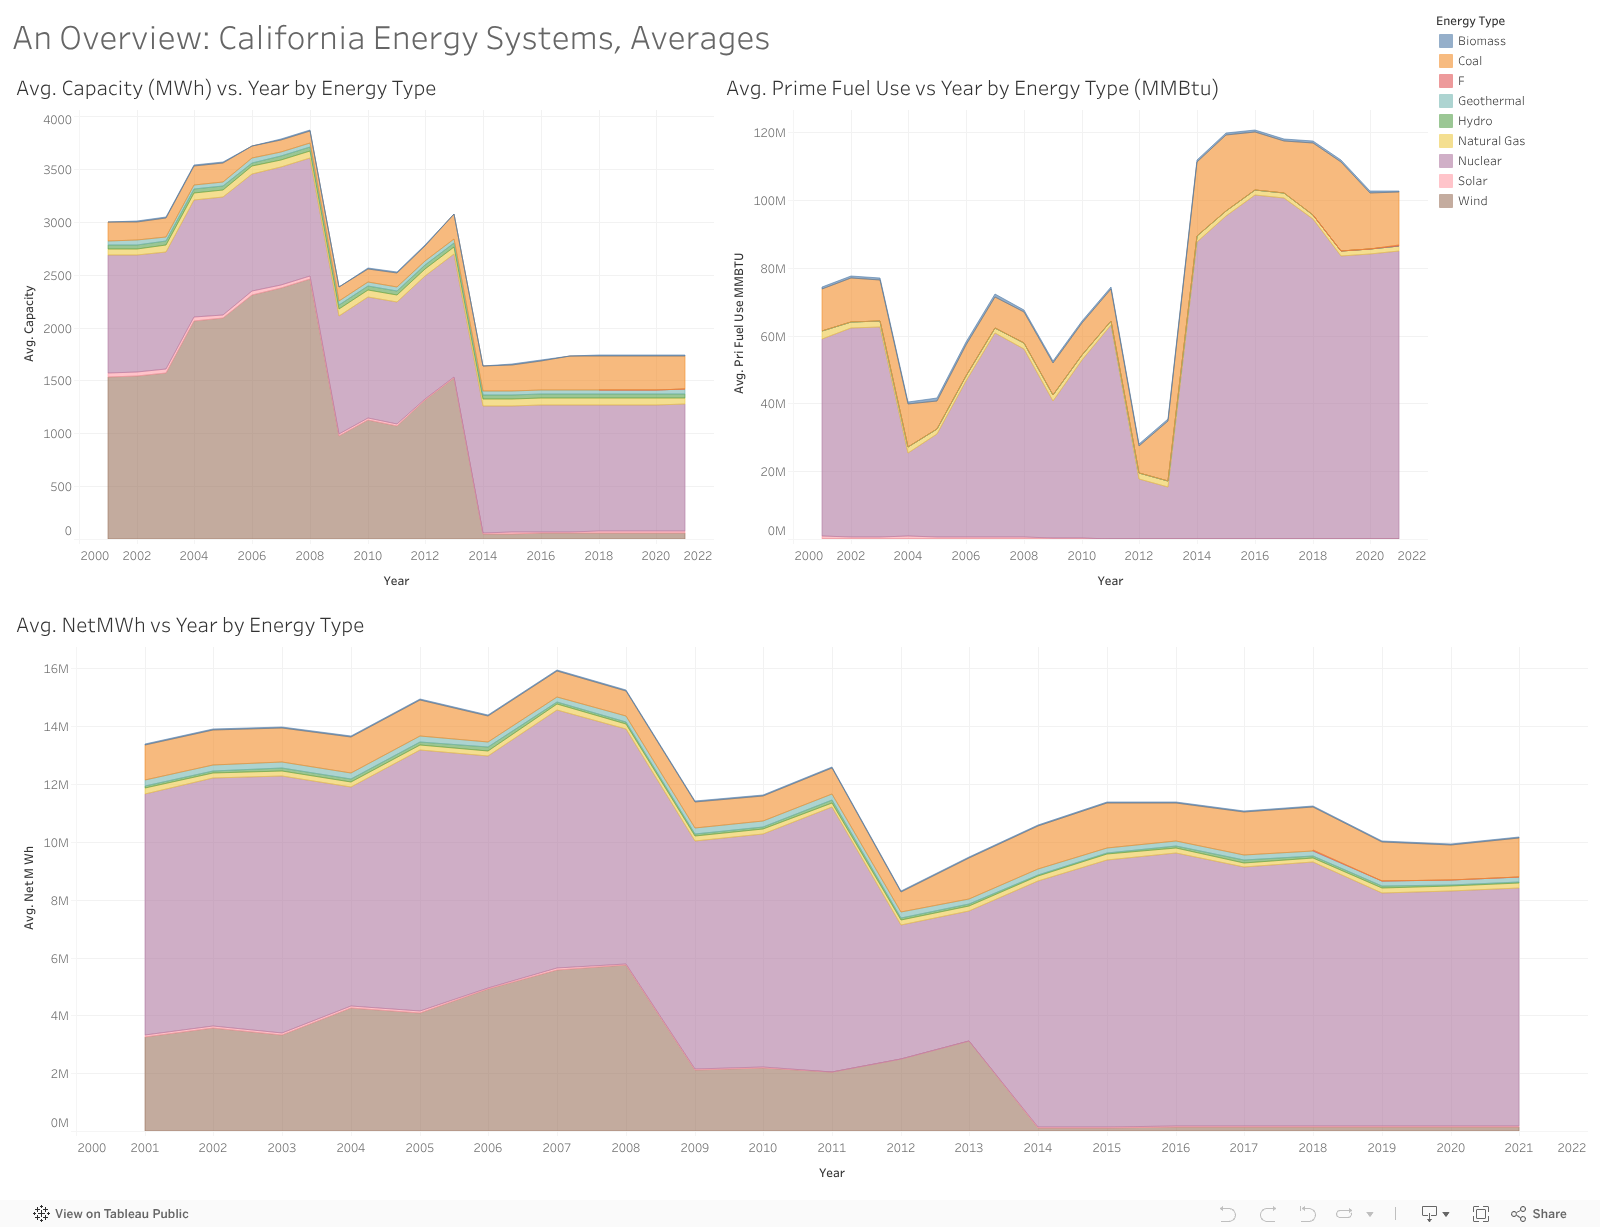
The second dashboard shows per-plant averages and uncovers something striking: nuclear plants average far greater capacity and net generation than any other energy type, while natural gas plants individually generate much less yet dominate California's total output simply through sheer numbers. This raises a pointed question about California's decision to decommission decommission its last nuclear plant, Diablo Canyon, while retaining hundreds of lower-output natural gas plants—a trade-off that looks increasingly difficult to justify as grid reliability concerns grow.
The second dashboard, below, shows the average capacity (MWh), prime fuel use (MMBtu), and net megawatt-hours generated for each plant color-coded by energy type. Notice, as mentioned in my original report, that nuclear energy has had the greatest average capacity, average prime fuel use, and, most importantly, average net generation.
Natural gas plants have a low average of net megawatt-hours generated; however, the total megawatt-hours generated by natural gas plants are much greater than any other type of plant. Without running the numbers (though this was done in Python in the original report), this implies that many natural gas plants are serving California. Comparably, the average generation and capacity of far fewer nuclear energy plants is much greater.